
Over the years, it was believed that fines in the range of 50–75 μm did not significantly erode metal due to smaller particle size and low impact on the target surface. However, it has been observed that fine particles can escape through most sand screens, making them almost unavoidable in oil and gas production. These fines can severely damage installations in places where coarse sand cannot reach in normal situations.4.5. Evidence from the oil and gas industry has proven that sand is one of the main causes of pipeline erosion. In the given work, dry and watery sand erosion of mild steel was studied for a better understanding of sand erosion in production lines.
The eroded sand particles were collected from the town of Bandar Seri Iskandar located in the state of Perak in Peninsular Malaysia. The composition of the sand samples was measured by EDX analysis. Figure 5 shows the EDX scan and spectrum of a rough sand sample, which has been refined for grain size classification. EDX analysis confirmed the presence of aluminum, silicon, phosphorus as well as carbon in the eroding sand sample. The existence of nitrogen, oxygen and fluorine in the sample was assumed due to the ambient air6.7.
EDX scan and spectrum of mine sand.
Abrasive erosion studies on mild steel performed using the dry sand impingement method under ambient temperature and atmospheric pressure conditions are reported in Figures 6 and 7. These were most likely of a physical phenomenon rather than a chemical process. Figure 6 shows the EDX spectra of untreated and treated mild steel coupons used as specimen metal in these experiments. Figure 6a reveals that the untreated sample was composed only of carbon, iron and nitrogen. Figure 6b shows the EDX spectrum of the metal plate after the erosion experiment. The composition of the eroded plate was considerably modified in these investigations. It reveals that some of the eroding particles were diffused into the metal surface during the impact of the sand. The post-process metal composition was changed to carbon, silicon, ferum, aluminum and phosphorus. It has been seen that sand impact erosion also changes the composition of metal samples8,9,10.

EDX of mild steel (6a) untreated and (6b) treated.

SEM images of eroded mild steel with (7a) 150 μm particles at 90° impact angle, (7b) 45 μm particles at 90° impact angle, (7c) particles of 150 μm at an impact angle of 45° and (7d) Particles of 45 μm at an impact angle of 45°.
Previous studies have reported that particle size significantly influences metal surface erosion by determining the number of particles impacting the solid surface.7,8,9,10. Particles smaller than 10 microns are transported with the liquid medium and rarely hit the wall, however, larger particles are likely to travel in a straight line and bounce off the walls. Larger particles with sizes greater than 1 mm move slowly and normally settle out of the fluid, so do not significantly damage the surface. There is also little evidence that particles with sharp edges cause more damage than those with rounded shapes.9,10,11. However, it would be difficult to conclude on the effect of variability in sand fineness and hardness on the rate of erosion in different production wells and fields.9.10. Due to the sharp surfaces, the sand particles used in given jobs can be more deadly to production lines.
SEM micrographs of mild steel samples bombarded for 1 hour with 45 μm and 150 μm sand particles at different impact angles are shown in Fig. 6a. After erosion experiments, the targeted regions of the samples were transformed into dark circles revealing the high surface roughness. The degree of surface roughness was strongly dependent on particle size and impact angle. A strong relationship was found between the particle size and the size of the damage scars on the metal surface9.10. Coarse sand eroded the metal more negatively than fine particles.
It has been noticed that the collision efficiency decreases with decreasing particle size10,11,12. Quantitatively, the decrease in collision efficiency and hence erosion can be attributed to the lower inertia of smaller particles that are not constrained to follow air moving around a body in its path. Therefore, larger particles will have higher inertia and momentum to impact the metal surface causing severe erosion. However, the presented results prove that fine particles can also cause significant erosion of metal surface even though the mass of fines is smaller compared to coarse sand. Thus, surface damage from fine particles can be significantly higher in areas where coarse sand cannot reach in normal situations.
The SEM images in Fig. 7 also reveals the effect of impact angle on surface damage. The highest metal erosion was observed at the 90° impact angle, which was gradually reduced by decreasing the impact angle to 30° in 15° steps. At 90°, the accelerated particles exhibited no angular slip and imparted maximum energy to the metal surface. However, at smaller impact angles, the sand particles exhibited angular slip due to the tangential path created by the inclined metal surface. The particle impact force was divided into axial and radial components. Here, only the axial component contributed to the energy transfer from the sand particles to the metal surface. As a result, the impact of the sand has been reduced and consequently the surface erosion.
The micro-hardness of the treated steel samples as a function of the angle of impact is reported in Fig. 8. Hardness of mild steel showed an increasing trend with impact angle. The overall hardness of samples treated with 150 μm and 45 μm sand samples was found in the range of 87.7–97.55 VHN and 88.34–102.31 VHN, respectively. It reveals that the hardness and density of sand particles impacting the metal surface were high enough to induce plastic deformation and evolution of microstructures on the surface of the sample. The increased hardness of the samples treated with 45 μm shows that the impact of the smaller particles on the surface formed fine grains, marten sites and residual stresses which subsequently increased the micro-hardness of the subsoil.13.

Micro-hardness of eroded steel specimens at different impact angles.
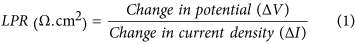
In addition to dry sand erosion, aqueous erosion of mild steel has also been investigated using an electrochemical technique. LPR monitoring is an effective electrochemical technique, which is used to assess the erosion-corrosion of metals. This involves monitoring a relationship between the current due to electrons and the electrochemical potential. The corresponding LPR curves are used to measure corrosion rates. In this relationship, the polarization resistance varies inversely with the corrosion rate. In this study, a three-electrode probe was added to the erosion process of mild steel. The electrodes were electrically isolated from each other and from the processing line3. A small potential (about 20 mV) was applied between the electrodes without affecting the corrosion process. The corresponding current was monitored and measured. The LPR, which is the ratio of the applied potential and the current between the electrodes, was measured for samples of mild steel in suspensions containing 5% by weight of sand particles of 45 μm and 150 μm.
Figure 9 shows the LPR curves of corroded mild steel in slurries of 45 μm and 150 μm sand particles. The polarization behavior of mild steel in 45 μm and 150 μm sand slurries was about 0.29 and 0.34 mm/yr, respectively. These results predicted high surface damage due to larger particles, which was expected in these experiments. Corrosion of mild steel samples was explained in terms of polarization resistance (Ω.cm2) current-potential density curves. Here, the bias resistance of the samples was calculated using the equation3.14:

Polarization curves of mild steel treated with 45 μm and 150 μm sand slurries.
From this equation, the polarization resistance of the samples in 45 μm and 150 μm sand slurry was calculated to be around 949 Ω.cm2 and 809 Ω.cm2, respectively. A decrease in LPR of samples generally suggests a decrease in polarization resistance in the presence of larger particles in the suspension. This trend reveals that the metal would suffer from higher corrosion rates in the fluids carrying the larger solid particles. The observed trend of the polarization resistance can be clarified in terms of the stability of the corrosion product layer formed outside. The LPR will remain more or less constant, if the product layer is stable and not separable from the metal surface. However, the LPR value will fluctuate if the product layer is not stable. In this case, the layer forms and detaches again from the metal surface14.